Glossary
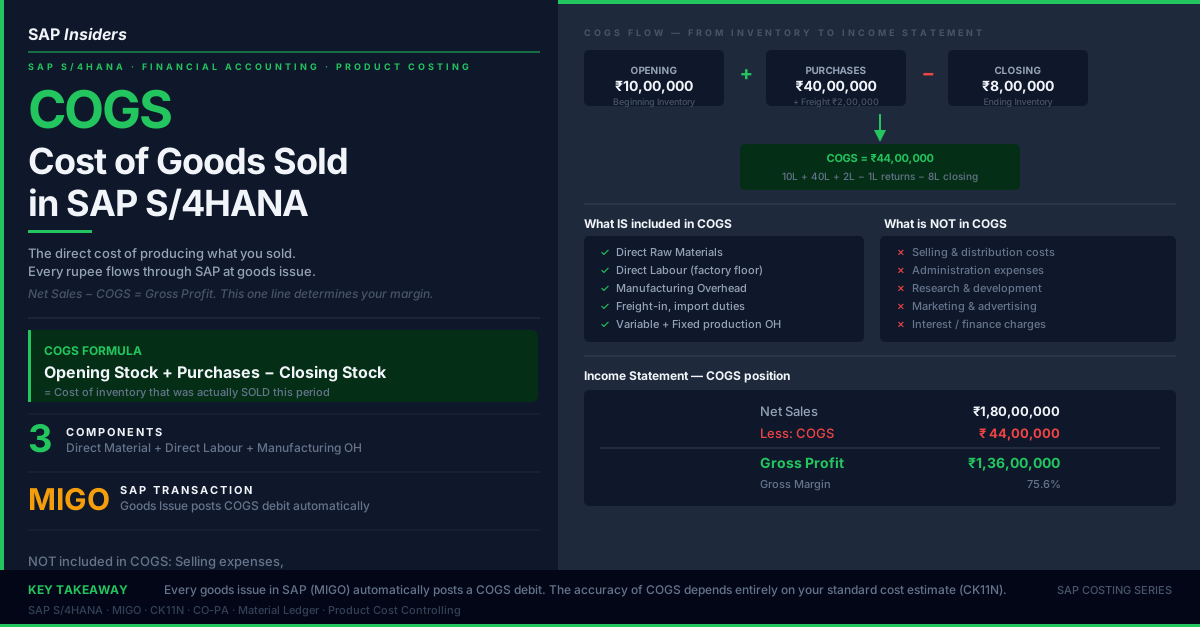
Theoretical COGS — what the Cost of Goods Sold should be based on the standard Bill of Materials (BOM), recipe, or routing. Calculated from the Standard Cost Estimate (CK11N).
Real COGS — what the Cost of Goods Sold actually was, based on inventory consumption recorded in the system (MIGO goods issues, production confirmations CO11N).
Variance — the difference between Real COGS and Theoretical COGS. A positive variance (Real > Theoretical) means you consumed more than the standard — waste, spoilage, or theft. A negative variance (Real < Theoretical) means you used less than planned — a favourable efficiency.
Material Ledger — SAP's actual costing layer that collects all real costs and computes the difference from the standard cost estimate.
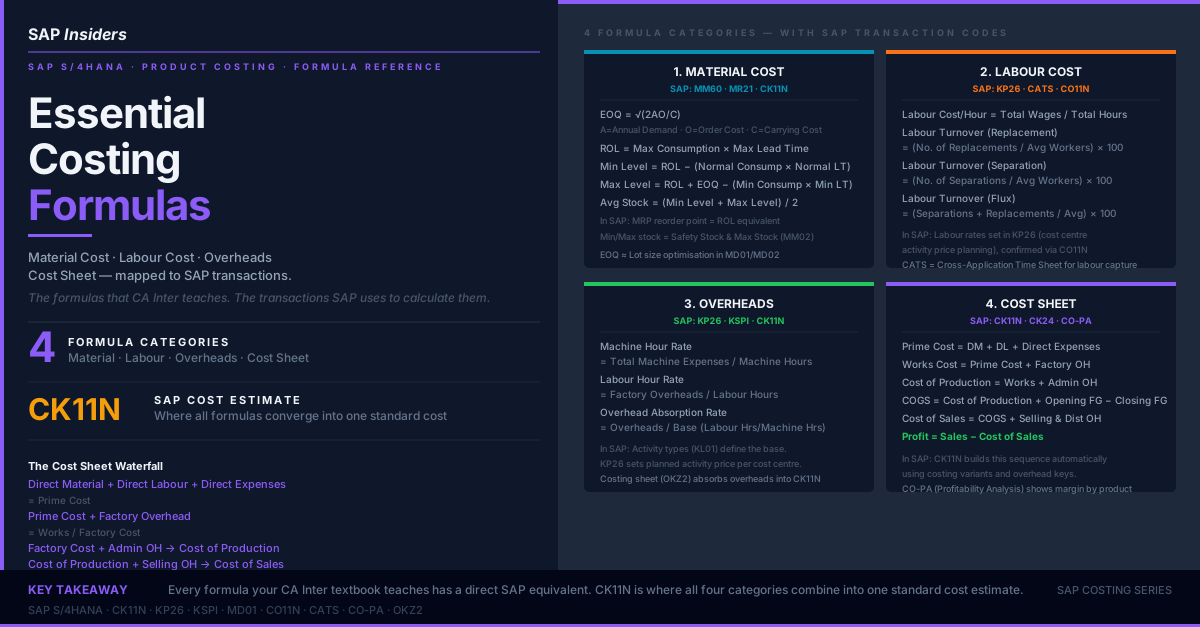
Reorder Point (ROL) — the stock level at which a replenishment order is triggered. Below this level, production or operations risk running out of material.
Every production operation has a gap between what costs should be and what they actually are. In a restaurant, the chef's recipe says 200g of butter per dish. But the kitchen actually uses 240g. That 40g — multiplied by 300 covers a day — is ₹9,000 in unaccounted cost disappearing every single day.
In manufacturing, the same principle applies at every stage: raw material yields, machine efficiency, labour productivity, and energy consumption all have theoretical benchmarks. When actual costs diverge from those benchmarks, the variance is hiding in your COGS line — invisible unless you measure it.
SAP Material Ledger is the tool that surfaces this gap. This article explains what the variance means, how to read it, what thresholds should trigger action, and exactly how SAP computes it.
Theoretical COGS — the benchmark
Theoretical COGS is what the income statement should show if everything went according to plan.
It is calculated from:
Bill of Materials (BOM): specifies exactly how much of each raw material is required per unit of finished product. If the BOM says 2.5 kg of steel per precision component, then producing 1,000 components should consume 2,500 kg of steel.
Routing / Recipe: specifies the labour hours and machine hours required per unit. If the routing says 0.4 machine hours per unit, 1,000 units should use 400 machine hours.
Standard Cost Estimate (CK11N): multiplies BOM quantities × material prices and routing hours × activity rates to produce a per-unit standard cost.
Theoretical COGS = Standard Cost per Unit × Units Sold
In SAP, this is the amount posted automatically at goods issue (MIGO, movement type 601). Every time a delivery is confirmed to a customer, SAP debits COGS at the standard cost.
Real COGS — what actually happened
Real COGS is what was actually consumed and recorded in the system:
- Actual raw material withdrawals from the warehouse (MIGO goods issues to production orders, movement type 261)
- Actual production confirmations (CO11N) recording hours worked
- Actual overhead absorption (based on confirmed activity quantities)
- Scrap and rework costs posted to the production order
At the end of the period, these actual costs are collected by the Material Ledger and compared to the standard.
Real COGS = Actual Material Cost + Actual Labour Cost + Actual Overhead Absorbed
The variance — and what it tells you
Variance = Real COGS − Theoretical COGS Variance % = (Variance / Theoretical COGS) × 100
| Variance Direction | What It Means |
|---|---|
| Positive (Real > Theoretical) | You used MORE than planned. Waste, spoilage, rework, theft, or inaccurate BOM. |
| Negative (Real < Theoretical) | You used LESS than planned. Better-than-expected efficiency, or under-reporting. |
| Zero | Theoretical = actual. Extremely rare — usually indicates a data quality issue. |
A positive variance is not automatically bad. If your BOM is deliberately conservative (built-in safety factors), a small positive variance is expected. The question is: how large is too large?
The traffic light thresholds
Industry practice — and the thresholds used by most SAP CO consultants — is as follows:
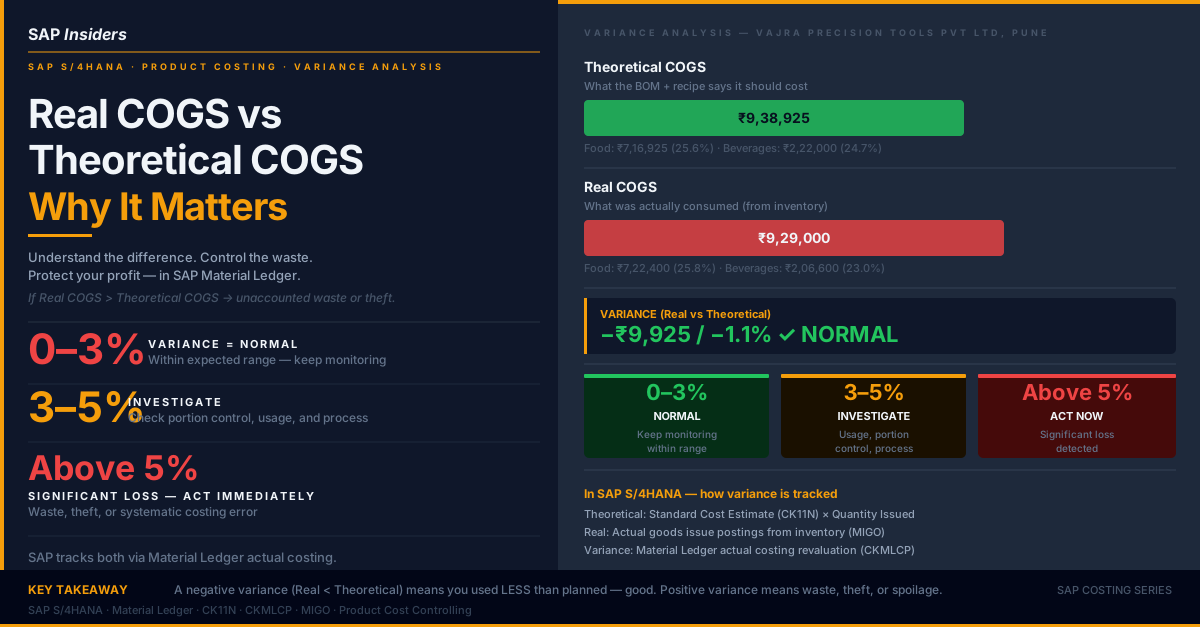
0% to 3% — Normal (Green)
Within this range, variance is within expected tolerance from measurement rounding, minor yield fluctuations, and approved BOM conservatism. No immediate action required. Monitor monthly to confirm the trend is stable.
3% to 5% — Investigate (Amber)
This level suggests a systematic issue that may not be an emergency but must be understood. Investigate:
- Are portions or quantities being measured accurately?
- Has a raw material specification changed but the BOM not been updated?
- Is there a new supplier whose material yield differs from the previous one?
- Is there a rework loop consuming extra material not captured in the BOM?
Above 5% — Significant Loss — Act Immediately (Red)
A variance above 5% represents a material misstatement of COGS and a real operational problem. At this level, possible causes include:
- Uncontrolled waste or spoilage (no waste recording in the system)
- Inventory theft
- Systematic BOM error causing ongoing incorrect production orders
- Production confirmation being made without actual goods issues (phantom confirmations)
At 5%+ variance, escalate to the operations and finance leadership. Do not close the period until the root cause is identified.
A worked example — Vajra Precision Tools Pvt Ltd, Pune
Vajra produces precision machined components for automotive OEMs. In May, the following was recorded:
Theoretical COGS (from CK11N standard cost × units sold):
| Component | Theoretical Cost | % of Sales |
|---|---|---|
| Material Cost | ₹7,16,925 | 25.6% |
| Labour + Overhead | ₹2,22,000 | 7.9% |
| Total Theoretical COGS | ₹9,38,925 | 33.5% |
Real COGS (from actual goods issues and confirmations):
| Component | Actual Cost | % of Sales |
|---|---|---|
| Material Cost | ₹7,22,400 | 25.8% |
| Labour + Overhead | ₹2,06,600 | 7.4% |
| Total Real COGS | ₹9,29,000 | 33.2% |
Variance:
Variance = ₹9,29,000 − ₹9,38,925 = −₹9,925 (−1.1%)
The variance is negative — Real COGS is ₹9,925 less than Theoretical. This is a favourable variance: actual material and labour consumption was slightly below the standard.
At −1.1%, this falls in the Green zone. No action required. The variance will be absorbed through Material Ledger revaluation at period end (CKMLCP).
Q: The next month, a machine calibration error caused 8% excess material usage on one product line. Theoretical COGS: ₹12,00,000. Real COGS: ₹12,96,000. What is the variance % and what action should be taken?
A: Variance = ₹96,000 / ₹12,00,000 = 8%. This is above 5% — Red zone. Escalate immediately. Check goods issue records (MB51) for the affected material, review the production order (CO03) for quantity variances, and investigate the machine calibration logs. Do not close the period without explanation.
How SAP Material Ledger computes this variance
SAP's Material Ledger runs an actual costing process (CKMLCP) at the end of each period. Here is what happens:
Step 1 — Collect actual costs: The Material Ledger aggregates all actual costs that hit each production order during the period — goods issues (MB51), activity confirmations (CO11N), overhead absorption (KSPI).
Step 2 — Calculate actual cost per unit: Total actual costs ÷ confirmed production quantity = actual cost per unit.
Step 3 — Compute variances by category:
- Price variance: actual material price vs. standard price
- Quantity variance: actual quantity consumed vs. BOM quantity at standard price
- Resource-usage variance: actual routing time vs. standard routing time
- Overhead variance: actual overhead rate vs. planned rate
Step 4 — Revalue inventory and COGS: The variance is split between units still in inventory and units already sold (COGS). COGS is revalued from standard to actual. The inventory remaining on the balance sheet is also revalued.
Step 5 — Settlement: The revalued amounts are posted to the G/L. The production order is settled and the variance accounts are cleared.
This is why period-end in SAP has a strict sequence: production order settlement (KO88) → cost centre assessment/distribution (KSV5/KSU5) → Material Ledger actual costing (CKMLCP) → CO-PA transfer (KE27).
Finding the variance in SAP reports
| Report | Transaction | What to look for |
|---|---|---|
| Production Order Variance | CO02 / CO03 | Variance category breakdown per production order |
| Material Price Analysis | CKM3N | Actual vs standard price per material |
| Material Ledger Report | CKMLCP | Period-end actual cost, revaluation amounts |
| Material Document List | MB51 | All goods issues — check for unusual movement types or quantities |
| CO-PA Margin Report | KE30 | Gross margin by product — spot products with collapsed margins |
| Variance Report | KKBC_ORD | Summarised variance by variance category across orders |
Common causes of high variance — and where to look in SAP
High material quantity variance (positive)
The most common cause. Actual consumption exceeded BOM quantity. Check:
- MB51: Are excess goods issues being posted against production orders?
- CO03: What is the confirmed yield quantity vs. order quantity? Low yield = scrap.
- Is the BOM (CS03) current? A design change may not have been reflected.
High price variance
Actual purchase price exceeded the standard price set in the material master.
- MR21: Has the standard price been updated to reflect new supplier prices?
- ME1M: What are actual purchase prices vs. the material standard price?
Labour efficiency variance (positive)
Actual machine/labour hours exceeded the routing standard.
- CA02: Is the routing (operation times) realistic for current equipment?
- CO11N confirmations: Are operators reporting accurate actual hours or defaulting to planned?
Overhead absorption variance
Overhead absorbed differs from actual overhead incurred.
- KSB1: Cost centre report — are actual costs in line with plan?
- Has production volume deviated significantly from the plan (over/under-absorption)?
Q: The Material Ledger shows a ₹2,40,000 favourable variance for the month. The FD is pleased. Should the variance simply be accepted as good news?
A: Not without investigation. A large favourable variance can mean: (1) actual production was less than planned but inventory was not correctly valued, (2) goods issues were not recorded for some production orders (phantom postings), or (3) the BOM is set too conservatively — meaning standard cost is too high and transfer prices to customers may also be too high. Favourable variances need explanation just as much as adverse ones.
Connecting variance analysis to the business
The purpose of tracking Real vs Theoretical COGS is not accounting compliance. It is operational control.
For the plant controller: The variance report (KKBC_ORD) shows which production orders are running over standard. This identifies which products, which machines, and which materials need attention.
For procurement: A persistent positive material price variance on a specific raw material signals that the standard price needs updating — or that the supplier negotiation is failing.
For production: A systematic quantity variance on one product line points to a process problem — calibration, yield, or operator technique — not a finance problem.
For the CFO: The aggregate variance after CKMLCP revaluation shows whether the business is more or less efficient than the standard. It closes the loop between the budget (standard cost) and reality (actual cost).
In SAP S/4HANA, with Material Ledger running actual costing, you have complete visibility into this gap — down to the individual production order, material, and variance category. The question is whether your team is reading the reports and acting on what they find.
Previous in the SAP Costing Series: COGS — Cost of Goods Sold in SAP S/4HANA.
Next: Essential Costing Formulas — EOQ, Labour Cost, and Overhead Rates mapped to SAP transactions.