A factory controller closes the books on the fifth working day of every month. Telephone bills, office-supply invoices, an IT-service contract, an energy bill and a facilities-maintenance contract have all landed on five overhead cost centres during May. None of those costs belong on those overhead cost centres at month-end. They have to land where the work happened — on Stamping, Assembly, Quality, Sales, R&D — in proportions that fairly reflect each centre's use of the underlying service.
That movement, from overhead cost centre to operational cost centre, is what cost allocations do. In SAP S/4HANA Controlling there are three named methods for doing it — Distribution, Assessment and Periodic Reposting — and choosing wrongly produces ledgers your auditor will spend three days arguing about.
This article walks the whole topic through one running manufacturing example with full journal entries. Before any of it makes sense, the words below need to mean the same thing to you and to the system. Read this glossary first — every term reappears in the diagrams.
The vocabulary — read this before anything else
Eleven words. One sentence each. The whole article rests on these.
- Cost centre — the smallest "place where cost is incurred" in Controlling. Examples:
202##-IT-Service,301-Stamping,401-Sales. Think department or work area. - Overhead cost centre — a cost centre that collects shared costs (IT, energy, facilities, admin) which don't directly make a product. Needs to be emptied at period-end by pushing its balance onto operational cost centres.
- Operational cost centre — a cost centre that does make or sell a product — Stamping, Assembly, Sales. The final resting place for cost.
- Cost element — the what kind of cost. Primary cost elements mirror P&L accounts (
63006000 Telephone,63006100 Office supplies). Secondary cost elements (categories 41/42/43) only exist inside Controlling and have no P&L mirror — they're internal labels for "assessment" or "activity allocation". - Cost element category — the system's rule for a cost element.
01= primary (mirrors P&L),42= internal assessment (the summarised one),43= internal activity allocation. Distribution uses 01. Assessment uses 42. - Sender — the cost centre being credited (emptied) by an allocation. The overhead pool.
- Receiver — the cost centre being debited (filled) by an allocation. The place that should bear a share.
- Tracing factor — the rule by which the sender's amount is split across receivers. PC count, square metres, headcount, hours, fixed %, fixed amount. The "how do we divide it" answer.
- Statistical key figure (SKF) — a non-financial number maintained monthly on a cost centre and used as a tracing factor. Examples: "Telephone units = 40", "Square metres = 1,200", "Headcount = 8". Maintained via Fiori app Manage Statistical Key Figure Values (GUI:
KB31N). - Cycle — a named container of one or more segments, executed in order at period-end. Examples:
IT-DIST-01,FAC-DIST-01,COPA-ASSESS-01. - Segment — the smallest allocation rule inside a cycle: this sender · these costs · these receivers · split this way. One cycle, many segments.
- Reversal — undoing a cycle run. Always available — period-end allocations are never "final". A reversal is itself a CO document with its own number.
- Cost element preserved — after the allocation, the receiver still sees the original cost element (
63006000 Telephone) on its line items instead of a generic94101000 IT Assessment. This is the single biggest difference between Distribution and Assessment.
Read once. Now the diagrams will speak.
Quick check — vocabulary
Q. Which cost element category is used by Assessment — and what does it mean? A. Category
42— "internal assessment". It's a secondary cost element that only exists inside Controlling. There is no matching P&L account.Q. What's the difference between a cycle and a segment? A. A cycle is the named container that runs at period-end. A segment is one allocation rule inside it — "this sender, these costs, these receivers, split this way". A cycle can have many segments.
Q. What does "cost element preserved" actually preserve? A. The primary cost element on the receiver's line items. After Distribution, the receiver still sees
63006000 Telephone ₹4,600. After Assessment, it sees94101000 IT Assessment ₹5,600.
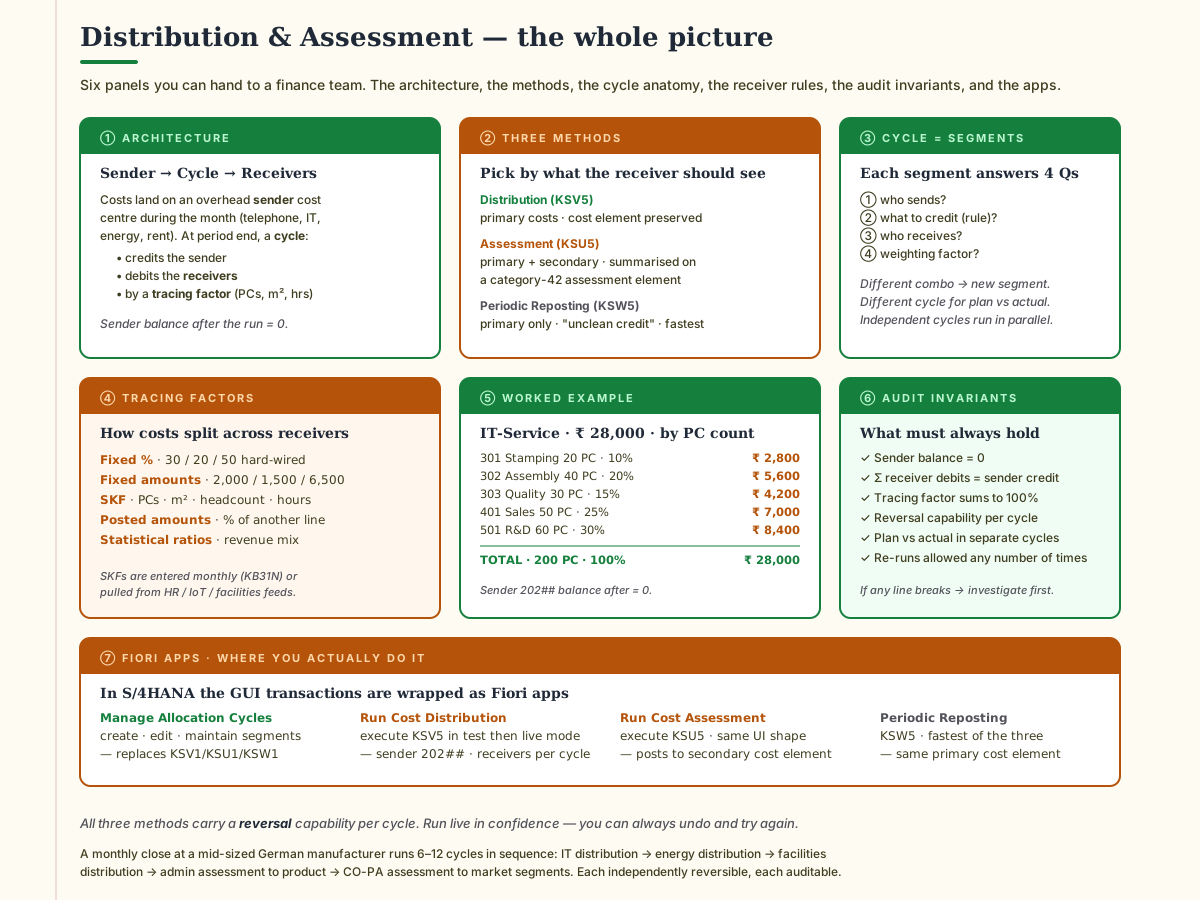
Here is the whole landscape in one frame. The article expands each panel underneath.
Meet Vajra Precision Tools
To keep this concrete, every example below uses the same imaginary company.
Vajra Precision Tools Pvt Ltd is an Indian precision machine-tool manufacturer. They build CNC milling machines and turning centres in a single plant in Pune, Maharashtra. The Controlling chart of cost centres is set up like this:
Overhead cost centres (senders) — collect cost during the month and are emptied at period end:
202##-IT-Service— the IT department's bills land here203##-Energy/Utilities— electricity, gas, water204##-Facilities/Maintenance— building cleaning, repairs
Operational cost centres (receivers) — bear product cost:
301-Stamping302-Assembly303-Quality Lab401-Sales501-R&D
The week we'll work through is the first five business days of June — the May-close window. The Controlling team runs the same playbook every month.
What cost allocation does — in one paragraph
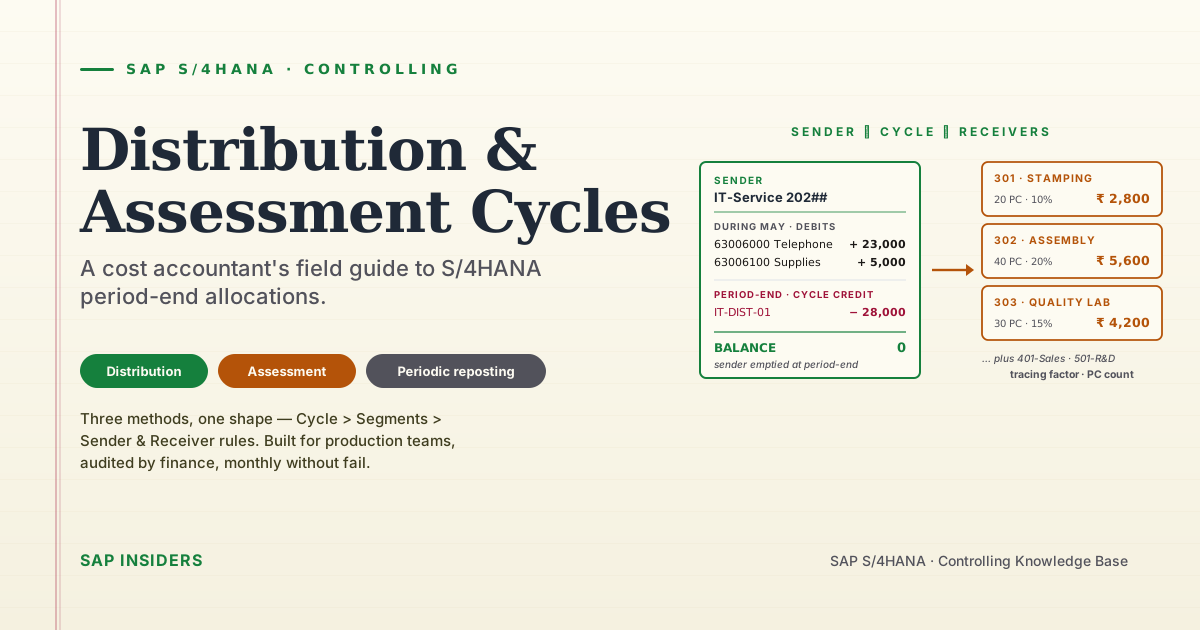
During the month, IT bills land on 202##-IT-Service. By month-end that cost centre holds, say, ₹28,000. That ₹28,000 is real cost that Vajra as a company has incurred — but it's sitting on an overhead cost centre that produces no products. To get to a meaningful product cost, the controller has to move that ₹28,000 onto the cost centres that consumed IT services — Stamping, Assembly, Quality, Sales and R&D — in proportion to how much IT each consumed. The proxy for "IT consumption" at Vajra is PC count.
That movement is the cycle. The sender ends at zero. The receivers each pick up their share. Product cost now reflects total enterprise cost.
Three methods — side by side
S/4HANA gives you three ways to do that movement. Same Sender → Receivers shape, three different posting behaviours.
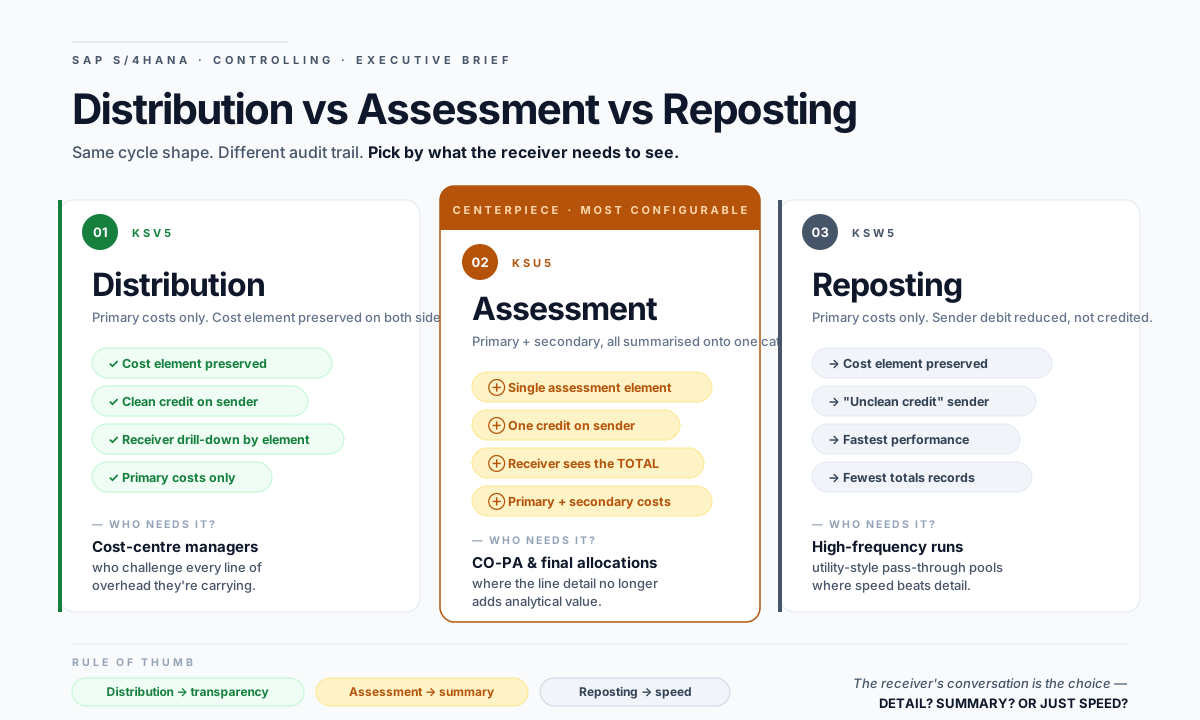
Read the matrix once. The headline difference is what the receiver sees:
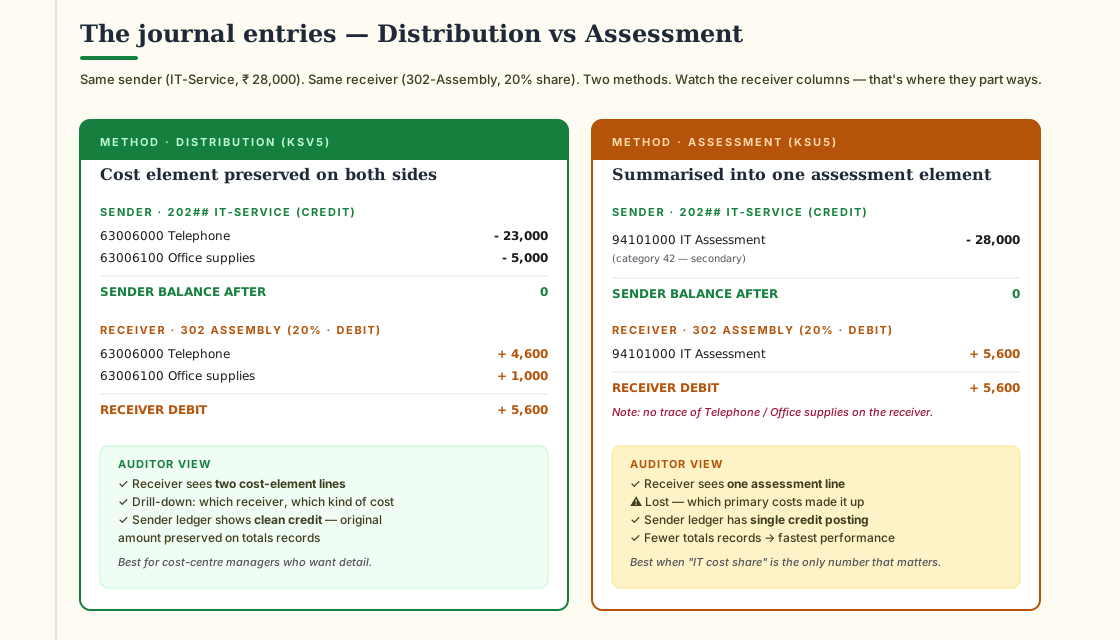
- Distribution preserves cost elements. The receiver's CO line items show "Telephone ₹4,600" and "Office supplies ₹1,000" — they can still see which kind of IT cost they're carrying.
- Assessment summarises. The receiver sees one line: "IT Assessment ₹5,600" — no idea what it was made of.
- Periodic Reposting preserves cost elements like Distribution does, but writes the sender side differently. The sender's debit total shrinks instead of a separate credit appearing. Fewer records, faster runs.
For most mid-sized manufacturers, the rule of thumb that holds 80% of the time is:
- Distribution for overhead service cost centres that should be transparent to receivers
- Assessment for the final allocation into CO-PA (profitability segments) where detail no longer adds value
- Periodic Reposting when allocation runs are nightly or hourly and you only need preservation of the cost element, not a separate credit posting
Quick check — methods
Q. Which method writes the fewest totals records, and why? A. Assessment. Each receiver gets ONE line (the summarised assessment element) instead of one line per cost element.
Q. Which two methods preserve the original primary cost element on the receiver? A. Distribution and Periodic Reposting. Assessment summarises everything onto a single category-42 element.
Q. What is an "unclean credit"? A. The sender side of a Periodic Reposting entry. Instead of a separate credit posting, the original debit total on the sender is reduced. Faster, but you lose the "how much did this pool collect" view on the sender's totals.
Anatomy of a cycle
A cycle is a named container of segments. Each segment answers four questions. Get the four answers right for each segment and the system does the rest.
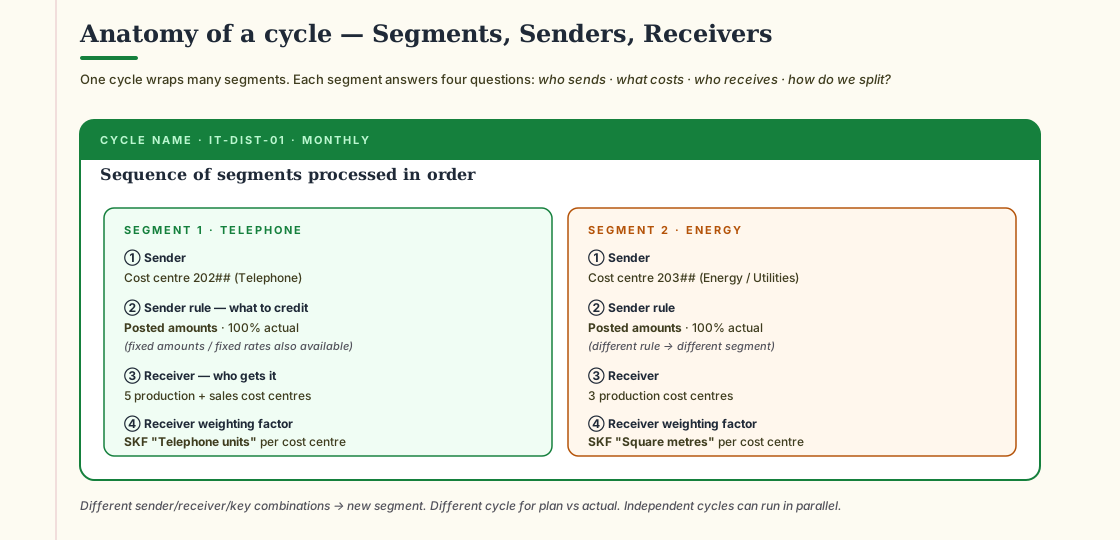
The four questions, written out:
- Who sends? A single cost centre, a range, or a group.
- What gets credited? A sender rule. Almost always "posted amounts × 100%". Variants: fixed amount per period, fixed rate per unit of tracing factor, sender share < 100% (leave residual on sender).
- Who receives? A list, a range, or a group of receiver cost centres.
- How is the amount split among receivers? A receiver weighting rule. The five common choices:
- Fixed percentages — e.g. 30 / 20 / 50 hard-wired
- Fixed amounts per receiver — e.g. ₹2,000 / ₹1,500 / ₹6,500
- Statistical key figure — the most common at month-end. PC count, m², headcount, hours.
- Posted amounts — split in proportion to another booked line on the receivers (e.g. "in proportion to salary costs already on the receiver")
- Statistical ratios — split in proportion to a calculated number, e.g. revenue mix
The rule: different combination of sender / receiver / weighting → different segment. A cycle with three segments processes them in order, writes one document per segment, and a single reversal undoes the whole cycle in one go.
A worked example — IT-Service distributed by PC count
Vajra's IT department spent ₹28,000 in May. That cost has landed on 202##-IT-Service as two primary costs:
- 63006000 Telephone — ₹23,000
- 63006100 Office supplies — ₹5,000
The controller runs one Distribution segment in cycle IT-DIST-01 that splits the ₹28,000 across the five receivers in proportion to PC count.
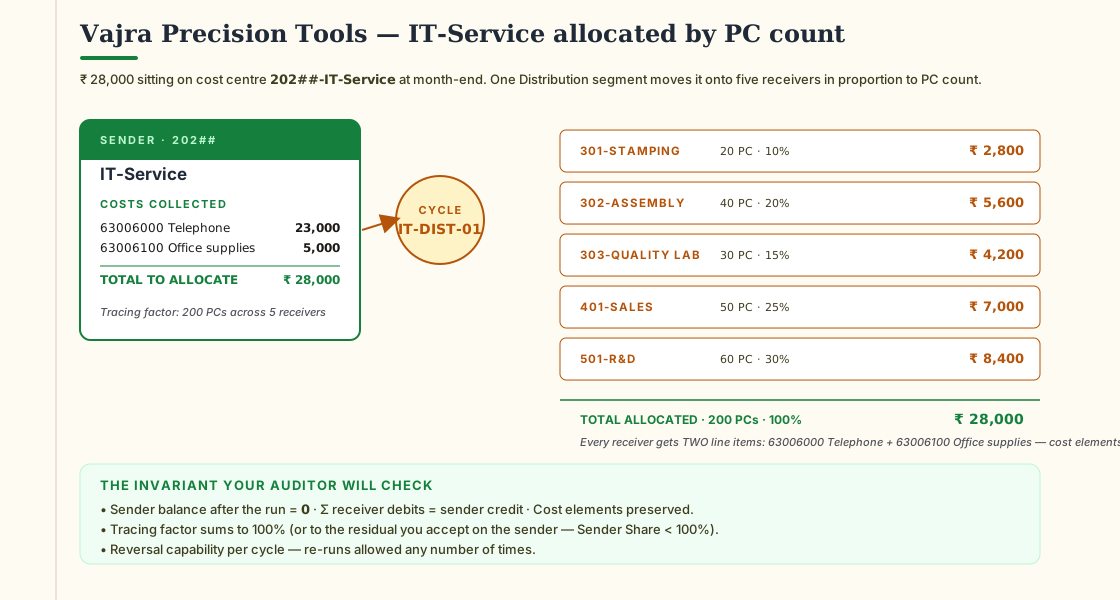
The receiver weights are stored as statistical key figure "PC count" on each receiver cost centre, maintained monthly via the Manage Statistical Key Figure Values Fiori app (or KB31N in the GUI). The system reads:
| Cost centre | PC count | Share | Allocation |
|---|---|---|---|
| 301-Stamping | 20 | 10% | ₹ 2,800 |
| 302-Assembly | 40 | 20% | ₹ 5,600 |
| 303-Quality Lab | 30 | 15% | ₹ 4,200 |
| 401-Sales | 50 | 25% | ₹ 7,000 |
| 501-R&D | 60 | 30% | ₹ 8,400 |
| Total | 200 | 100% | ₹ 28,000 |
After the run, 202##-IT-Service shows balance zero. The ₹28,000 has been pushed out to where the IT was consumed.
Quick check — the calculation
Q. If 302-Assembly had 80 PCs next month instead of 40, what would its allocation be (assuming the same total pool and the same other receivers)? A. Total PCs = 240 instead of 200. Assembly's share = 80/240 = 33.3% → ₹9,333 of the ₹28,000.
Q. You run the cycle and find ₹500 left on the sender afterwards. What are the two most likely causes? A. (1) Tracing factor doesn't sum to 100% — an SKF wasn't maintained for one receiver. (2) The sender rule was set to "Sender Share < 100%" deliberately to leave a residual.
Q. Same question — but the sender now shows a negative balance after the run. What happened? A. Fixed amounts on the segment exceeded the actual posted amount on the sender. The cycle over-allocated. Reverse, switch to "posted amounts" rule, re-run.
The journal entries — Distribution vs Assessment
This is the panel cost accountants and auditors actually argue about. Same sender (IT-Service, ₹28,000), same receiver (302-Assembly, 20% share), two methods, completely different ledger fingerprint.
The journal entries are the auditor's view. They tell you what the system wrote. But the business question — Distribution or Assessment — gets decided one place: the receiver's monthly cost-centre report. Here is what 302-Assembly's manager opens on Monday morning under each method. Same total. Same money. Two completely different pictures.
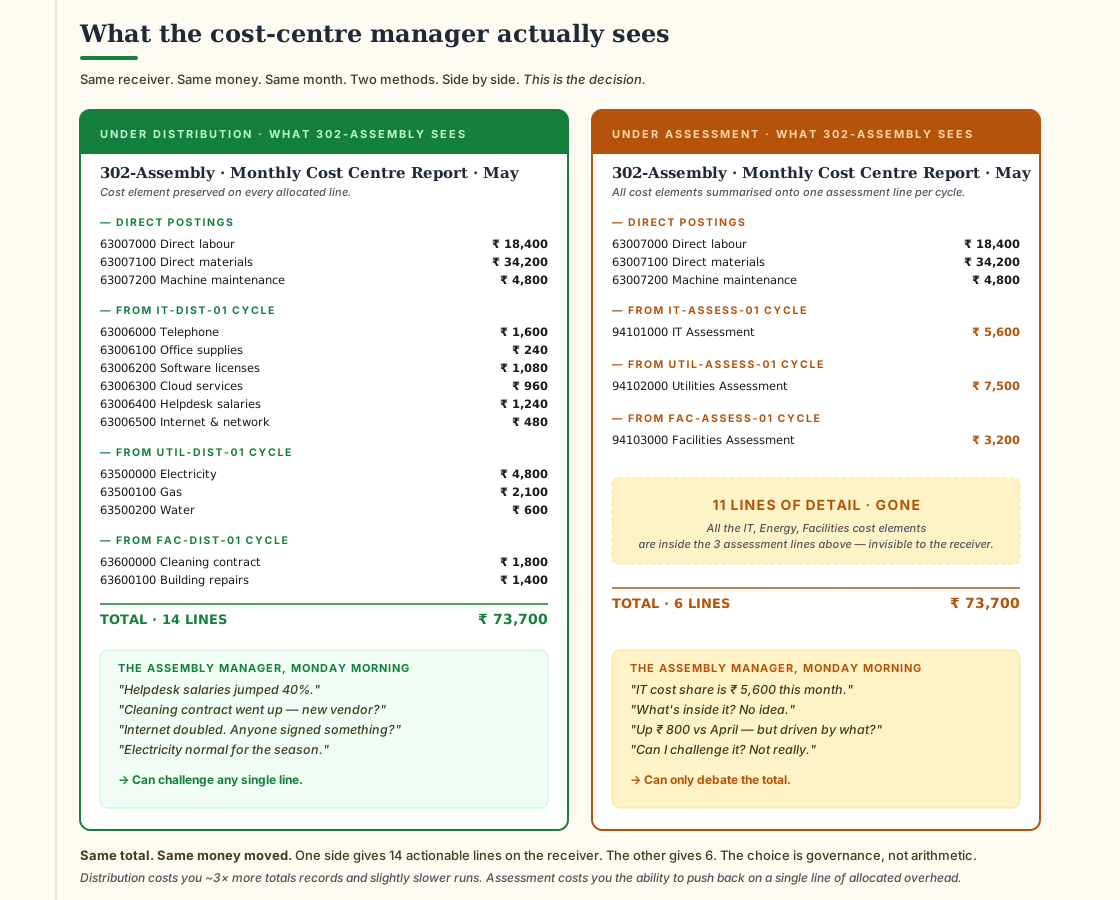
The arithmetic is the same: ₹73,700 lands on 302-Assembly either way. The governance is not. Under Distribution the Assembly manager has fourteen lines she can defend or challenge. Under Assessment she has three lines she has to accept on trust. That choice — can my managers push back on the overhead they're carrying? — is the entire question.
Performance and audit trail follow from the diagram, not the other way round:
- Distribution writes ~3× more totals records than Assessment. For a mid-size manufacturer that's milliseconds at month-end — irrelevant.
- Assessment runs fast and tidy. For 100,000+ cost-centre estates with hourly allocations, the speed becomes real.
- The cost-centre P&L drill-down report only sees what was posted to it. Choose the method that matches the conversation you want managers to be able to have.
Quick check — the choice in your org
Q. Your CFO insists on one IT line per cost-centre report, full stop. Which method? A. Assessment — the receiver sees exactly one assessment line per cycle. That's the whole point.
Q. Your Assembly manager just told you helpdesk salaries are out of control and she wants to challenge them at the next operations review. Which method makes that conversation possible? A. Distribution — it preserves
63006400 Helpdesk salariesas a separate line on the receiver. Under Assessment that data is gone the moment the cycle runs.Q. Your IT charge-back model is fixed by management decree at 30% Stamping / 20% Assembly / 50% R&D — no SKF, no negotiation. Which sender rule do you choose? A. Receiver weighting = fixed percentages. The values are stored on the segment itself, no SKF maintenance required. Cleanest possible setup.
Periodic Reposting — the silent third option
The third method, Periodic Reposting (KSW5), looks almost identical to Distribution but with one key difference: the sender side is written as a negative debit instead of a clean credit. The receiver side is identical to Distribution — same primary cost element, same amount.
What this means in practice: on the sender's totals records, the original ₹28,000 no longer appears as a debit. It's been silently reduced to zero. You can't query "how much did IT-Service originally collect this month" from the sender's totals — you'd have to look at line items.
That trade is what makes it fast. Fewer records written, fewer indices updated, faster month-end. Use it when:
- You allocate the same overhead pool every month with the same rule
- Nobody asks "how much was originally posted" on the sender — only "how much did we push out"
- You're running nightly or weekly allocations rather than just at period-end
Periodic Reposting is the default for utilities-style allocations where the sender is a pass-through and the originally-posted amount has no analytical value beyond "total to push".
The five-day Vajra close — how all three show up
Here's how the methods actually appear inside one company's monthly close. Vajra's controller runs the May close on the first five working days of June.
Day 1 — open the close
- Run Periodic Reposting cycle
UTIL-REPOST-01to push energy meter readings from the central utilities sender to consuming cost centres. Speed matters; the originally-posted amount has no analytical value. - This is the first allocation because energy receivers will themselves become senders later in the cycle chain.
Day 2 — IT and telephone
- Run Distribution cycle
IT-DIST-01(the worked example above). ₹28,000 → five receivers by PC count. - Cost elements 63006000 Telephone and 63006100 Office supplies are preserved on every receiver. The Quality Lab manager, looking at her cost centre report, sees: "yes, my ₹4,200 share is 82% telephone, 18% supplies — that's roughly proportional to the company average, fine".
Day 3 — facilities
- Run Distribution cycle
FAC-DIST-01for204##-Facilities/Maintenance. Cleaning contracts, repair labour, security. Tracing factor: square metres. - Same pattern as Day 2. Cost elements preserved.
Day 4 — administration assessment to product cost centres
- Run Assessment cycle
ADMIN-ASSESS-01. Pool of admin costs (HR, Finance ops, Controlling itself) is summarised into a single secondary cost element94501000 Admin Assessmentand pushed onto production cost centres only (not Sales or R&D). - Why Assessment here? Because product cost reports only want one line for "share of admin overhead". Drill-down to "how much of that admin share was HR vs Finance" adds no value to production cost analysis.
Day 5 — CO-PA assessment to market segments
- Run Assessment cycle
COPA-ASSESS-01. Costs sitting on Sales and Marketing cost centres are pushed into profitability segments (the CO-PA characteristics — product group × region × customer). - The receiver is no longer a cost centre. It's a profitability segment. The cost element is again a secondary, category-42 assessment element.
Five cycles. Three methods. One auditable trail.
CO-PA Assessment — pushing into profitability
The final allocation in the chain — Day 5 above — deserves its own note. Up to here, allocations have moved money between cost centres. CO-PA Assessment moves money from a cost centre to a profitability segment — a combination of characteristics like:
Product group   = "CNC Milling"
Sales region    = "Germany South"
Customer group  = "Tier 1 Industrial"
The receiver rule on a CO-PA Assessment is usually one of:
- Posted amounts — push the admin share in proportion to revenue already booked to each segment
- Statistical ratios — push by quantity sold or contribution margin
- Fixed percentages — hard-wired by management decision
The mechanics are identical to a regular Assessment cycle (KSU5 / Run Cost Assessment). The only difference is the receiver type: profitability segment instead of cost centre. The cycle structure, the segments, the test/live run, the reversal — all the same.
Plan vs actual — separate cycles
A point that trips up new controllers: cycles are either plan or actual, never both. A plan version of Distribution lives in cycle IT-DIST-01-PLAN and runs against plan version 0. An actual version lives in IT-DIST-01 and runs against actuals. They have the same segments, the same senders, the same receivers — but they are separate cycles in the system.
This is on purpose. Plan and actual run at different times in the close calendar, with different reversal needs, against different totals tables. Keeping them separate prevents accidental cross-version postings.
What the Fiori apps look like
In S/4HANA the old GUI transactions still work, but the day-to-day experience runs through Fiori apps. Map:
| Old GUI transaction | Fiori app | What you do |
|---|---|---|
KSV1 / KSU1 / KSW1 | Manage Allocation Cycles | Create cycle headers; add/edit segments |
KSV5 | Run Cost Distribution | Execute distribution in test or live mode |
KSU5 / KSUB | Run Cost Assessment | Execute assessment in test or live mode |
KSW5 | Run Periodic Reposting | Execute reposting in test or live mode |
KB31N | Manage Statistical Key Figure Values | Maintain PC count, m², headcount per month |
S_ALR_87005742 | Cost Centre Actuals/Plan/Variance | Read result of allocations on receivers |
The Fiori shell makes test runs explicit (a clear "Test Run" toggle), surfaces validation errors before live posting, and presents the reversal action prominently. Run live in confidence.
Common pitfalls that send auditors into orbit
A non-exhaustive list of the issues every cost accounting team eventually meets.
1. Tracing factor doesn't sum to 100%. The system warns but won't always block. Either accept a sender residual (Sender Share < 100%), or fix the SKF values. Don't leave it as silent leakage.
2. Receiver weighting based on negative posted amounts. If you split "in proportion to revenue already on the receiver" and one receiver has a credit-balance revenue (returns), the system can allocate negative IT cost to that receiver. Switch to a non-negative tracing factor (PC count, m²) for receivers that can go negative.
3. Receiver in two cycles' receiver lists, sender in neither. Receiver gets debited twice — once by each cycle. Audit trail still ties out, but P&L analysis at cost centre level becomes confusing. Convention: every cost centre is either a sender or a receiver in a given cycle chain, never both.
4. Forgetting to maintain SKFs. If "PC count" isn't entered for the new month, the cycle uses the previous month's values (carry-forward). Often correct, sometimes wrong. Build the SKF-maintenance step into the close checklist.
5. Running the same cycle twice without a reversal. Receivers double up. Test-run mode exists to prevent this — every cycle execution should be Test → review variance report → Live. If a live run goes wrong, reverse it (the reversal log itself is a CO document).
6. Choosing Assessment when receivers want Distribution. Once you summarise into a secondary cost element, you can't get the underlying primary mix back without reversing and re-running. Default to Distribution unless you have a specific reason to summarise.
7. Cycle and segment naming that doesn't survive a team handover. Z_CYC_01 tells the next controller nothing. IT-DIST-01-MONTHLY-PCCOUNT survives a handover.
Reversal — the safety net
Every allocation cycle is reversible. The Run Cost Distribution / Run Cost Assessment / Run Periodic Reposting apps each carry a Reverse action that:
- Picks the most recent live execution of the cycle
- Generates an opposite-signed CO document
- Resets the receivers and the sender to pre-run state
A reversal is itself a CO document with its own number — not an erasure of the original. The audit trail shows: ran on day 2 at 14:03, reversed on day 2 at 14:47, re-ran on day 2 at 15:12 with corrected SKFs. That's three documents, all visible, all explainable.
Treat live runs as cheap. They are.
FAQ
Q: Distribution or Assessment — which is "better"? Neither. Distribution preserves detail and uses more records. Assessment summarises and runs faster. Pick by what the receiver should see.
Q: Can a single cycle mix Distribution and Assessment segments? No. A cycle is either a Distribution cycle, an Assessment cycle, or a Periodic Reposting cycle. Mixing methods means running multiple cycles in sequence.
Q: What's the cost element category for an assessment element? 42 — Internal Assessment. (Distribution and Periodic Reposting use the original primary cost element, category 01.)
Q: How do I know if my SKF tracing factor is "fair"? Audit-defensible factors are objective and verifiable. PC count is auditable (someone can walk the building and count). "Manager's judgement of IT use" is not. Use the most objective factor you can sustain.
Q: Are allocations the only way to spread overhead? No. Direct activity allocation (KB21N) charges activity hours at a planned rate and is the right tool when a service centre measures its output (machine hours, lab tests). Cycles are for pool-style overheads where there's no direct measurement.
Q: Do these still work in S/4HANA Public Cloud? Yes. The Fiori apps map directly. The GUI transactions are not available in Public Cloud — you must use the apps. Cycle modelling is identical.
Q: How long does a typical month-end allocation run take? For a mid-sized manufacturer with 6–12 cycles, total wall-clock time is usually under 15 minutes. Periodic Reposting is the fastest, Distribution the slowest because of the cost-element preservation.
Key takeaways
- Cost allocation moves cost from overhead-pool cost centres to operational cost centres in proportion to a tracing factor at period-end.
- S/4HANA offers three methods: Distribution (KSV5, primary costs, cost element preserved, clean credit), Assessment (KSU5, primary + secondary, summarised on a category-42 element, single credit), Periodic Reposting (KSW5, primary costs, cost element preserved, unclean credit, fastest).
- The shape of every cycle is the same: Cycle → Segments → Sender · Sender Rule · Receivers · Receiver Weighting.
- The five common weighting rules are fixed %, fixed amounts, statistical key figures, posted amounts and statistical ratios. SKFs (PC count, m², headcount) dominate at mid-sized manufacturers.
- The auditor's invariants: sender balance = 0 after run, Σ receiver debits = sender credit, tracing factor sums to 100%, every cycle is reversible.
- Distribution for transparency to receivers. Assessment for CO-PA and final summarised allocations. Periodic Reposting for speed when the originally-posted amount has no analytical value.
- The Fiori apps Manage Allocation Cycles, Run Cost Distribution, Run Cost Assessment and Run Periodic Reposting replace the KSV1/KSU1/KSW1/KSV5/KSU5/KSW5 GUI transactions; test runs are explicit and reversals are first-class.
Five working days, three methods, one closed book. That's the rhythm of cost allocation in S/4HANA — and once the diagrams above are nailed to the wall behind your desk, the close stops feeling like wizardry.